AI이상탐지 및 예측과 분석을 통한 원인 파악의 구조로 기술을 제공합니다.

AI 이상탐지 & 예측 기능

정밀한 원인 분석 진단 기능

다양한 형태의 분석 시각화 기능

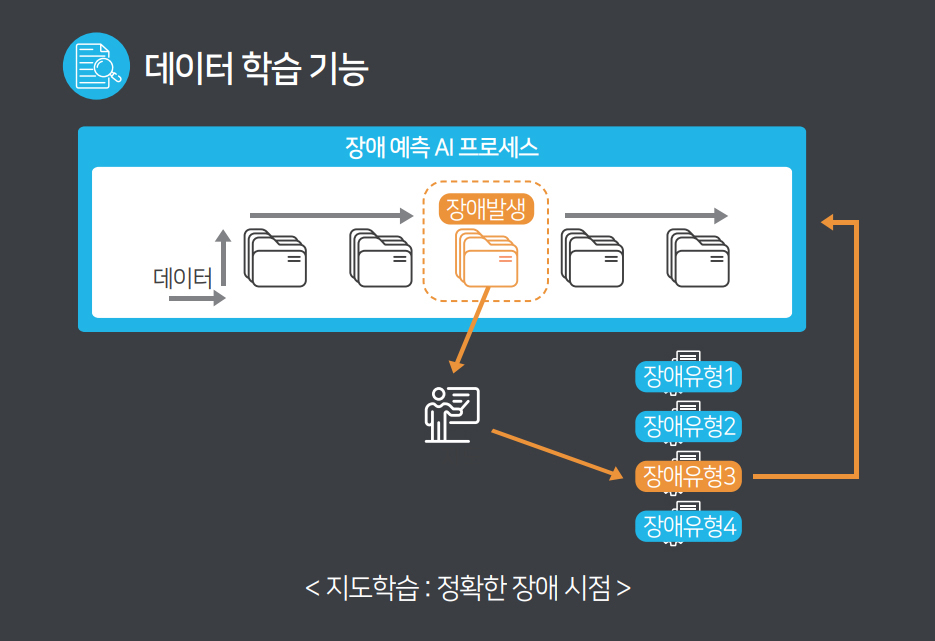
데이터 수집 및 학습 기능

이벤트 알람 및 리포팅 기능

서비스 중심 통합 모니터링 기능
운영중인 ICT 인프라로부터 수집된 다양한 지표와 로그를 수집, 분류하여 빅데이터 저장하고 AI 엔진을 통해 장애 예측과 원인분석을 제공합니다.
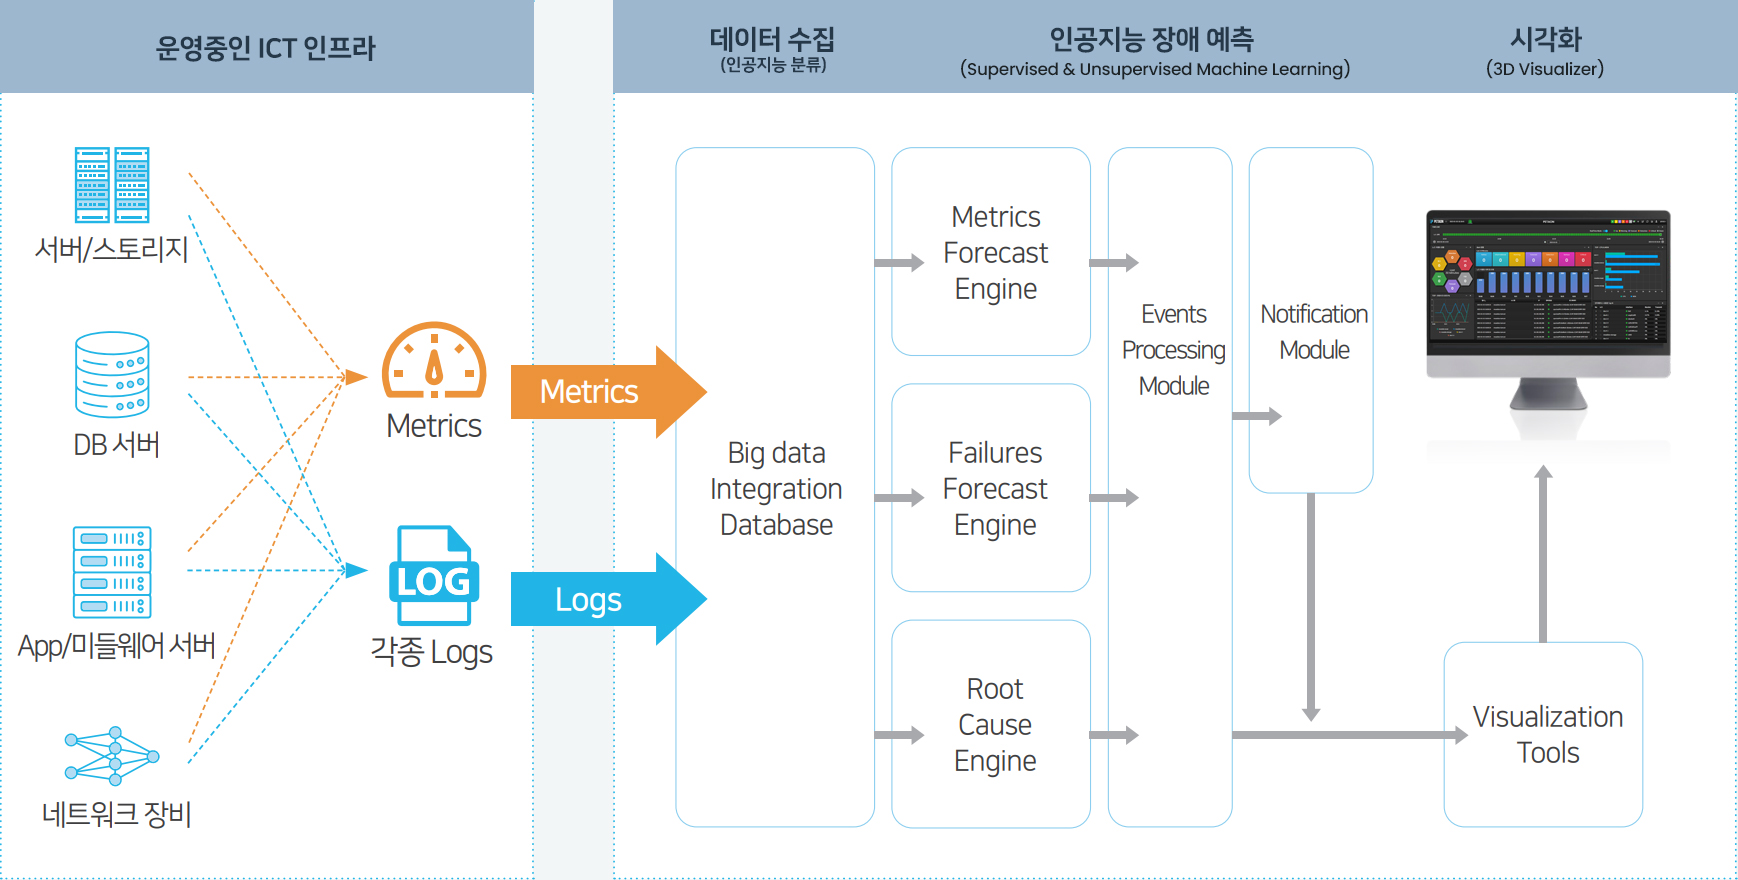
페타온 포캐스터의 AI 데이타 수집 과정 흐름도입니다.
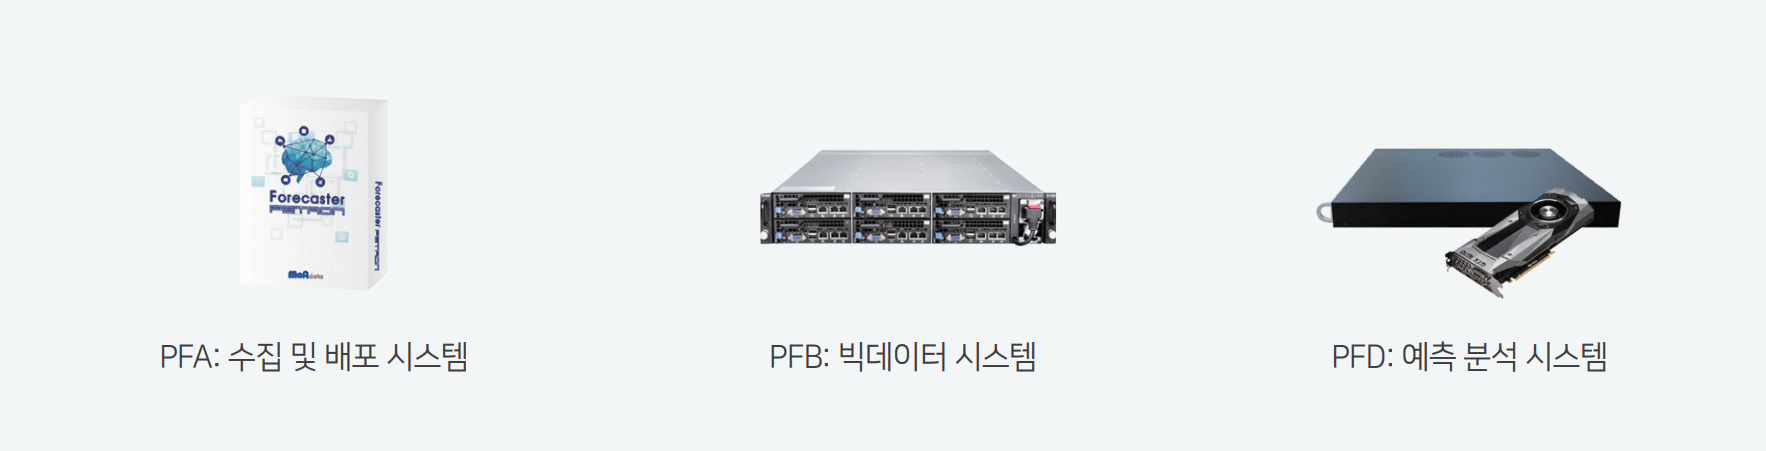
페타온 포캐스터 패키지 제품군입니다.
ICT, 인프라에서 발생할 수 있는 이상 징후를 탐지, 근본 원인과 해결 방안을 제시하여 문제 해결 시간을 단축하도록 제공합니다.

이상 탐지 기능
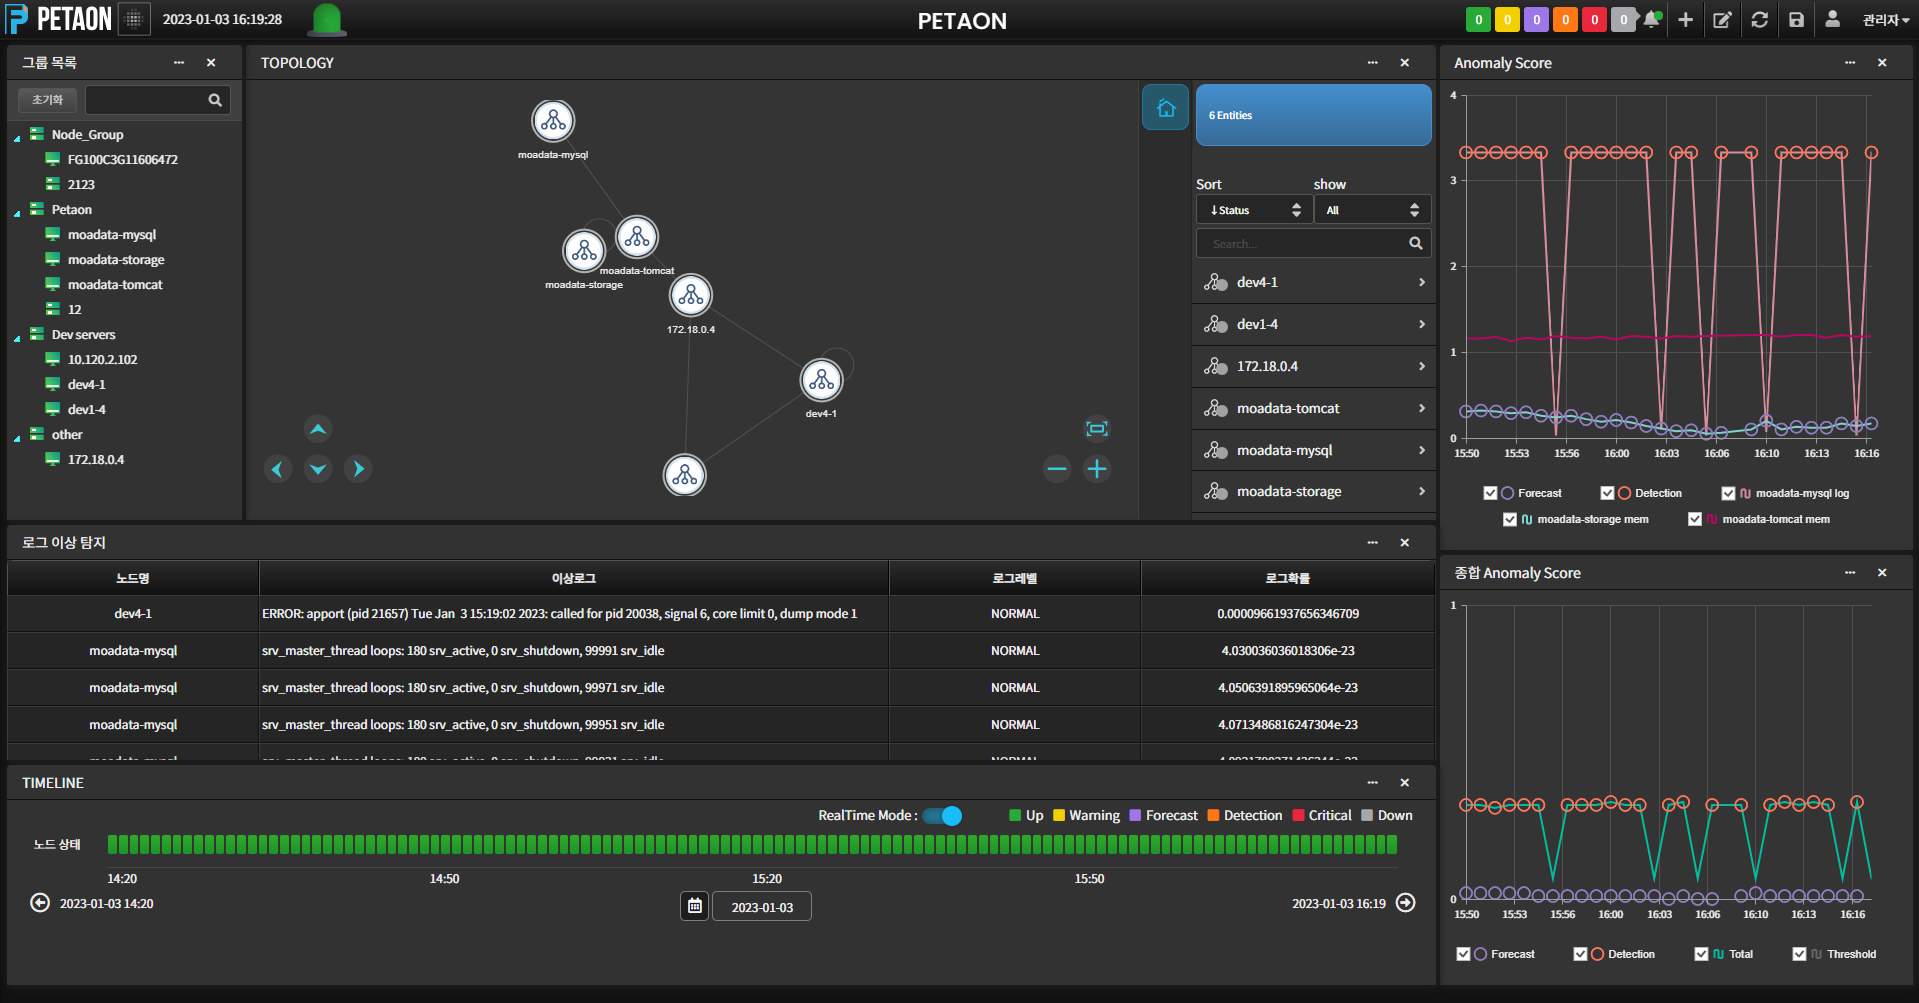
종합 이상점수가 동적 임계치를 초과할 경우 이상 이벤트로 탐지하 며 탐지 결과를 시각화 하여 이상 탐지 이벤트를 확인할 수 있습니다

이상 예측 기능
최근 시계열 데이터의 패턴에서 전조증상 패턴이 식별되면 이상 예측 이벤트를 시각화하여 이상 예측 이벤트를 확인할 수 있습니다.
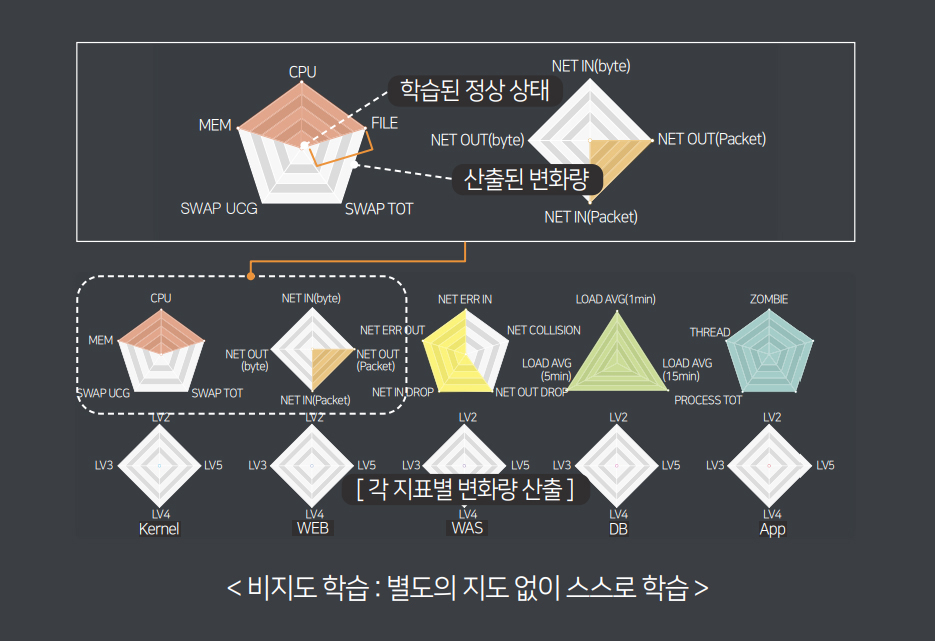
- 시그니처 기반의 탐지가 아닌 자가 학습에 의한 이상 예측 기능 제공.
- 딥러닝 등 기계학습을 통한 인공지능 기반 이상 탐지 및 예측 기능.
- 분석 매트릭 간의 상관분석 제공.
- 시스템 및 서비스별 상관분석을 통한 성능 변화 및 사전 이상 팀지 예측.
타임라인 기반의 분석 전용 개별 대시보드를 제공하며 위젯의 과거 데이터를 동기화하고 계층적 구조화 분석이 용이 하도록 지원합니다.

이상 탐지 기능
이상 분류는 시계열 데이터의 패턴을 분류, 사용자가 정의한 이상 이벤트와의 유사도를 판단, 이벤트 유형과 확률을 시각화하여 사용자가 확인할 수 있습니다.

이상 예측 기능
최근 시계열 데이터의 패턴에서 전조증상 패턴이 식별되면 이상 예측 이벤트를 시각화하여 이상 예측 이벤트를 확인할 수 있습니다.
- 독립적인 데이터/장비 등 개별 모니터링 요소가 서비스 및 장비 운영 상에서 발생되는 로그 데이터에서 진단된 장애 이벤트와의 연관관계를 통해 원인 로그를 식별하여 제공하는 기능.
타임라인 기반의 분석 전용 개별 대시보드를 제공, 위젯의 과거 데이터를 동기화하고 Knowledge DB 를 통해 분석할 수 있도록 제공 합니다.

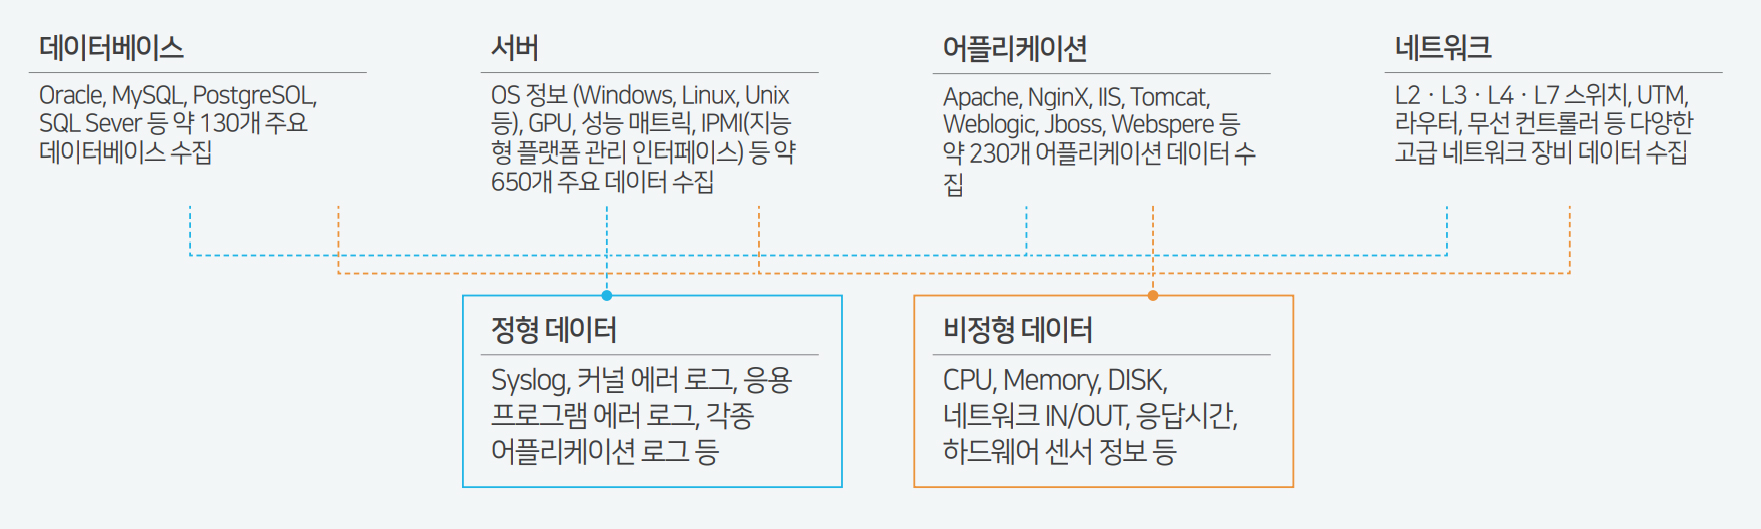
데이터 수집 기능
데이터 수집은 수집 데이터를 시각화하여 설정 및 관리할 수 있는 인터페이스를 제공. 설정된 데이터는 에이전트, SNMP 등 다양한 방식으로 수집기에서 설정된 데이터를 수집. 이상 탐지, 이상 분류, 이상 예측, 원인분석 및 대응 가이드에 이르는 핵심 인공지능 기능들을 거쳐 분석 결과로 확인할 수 있습니다.
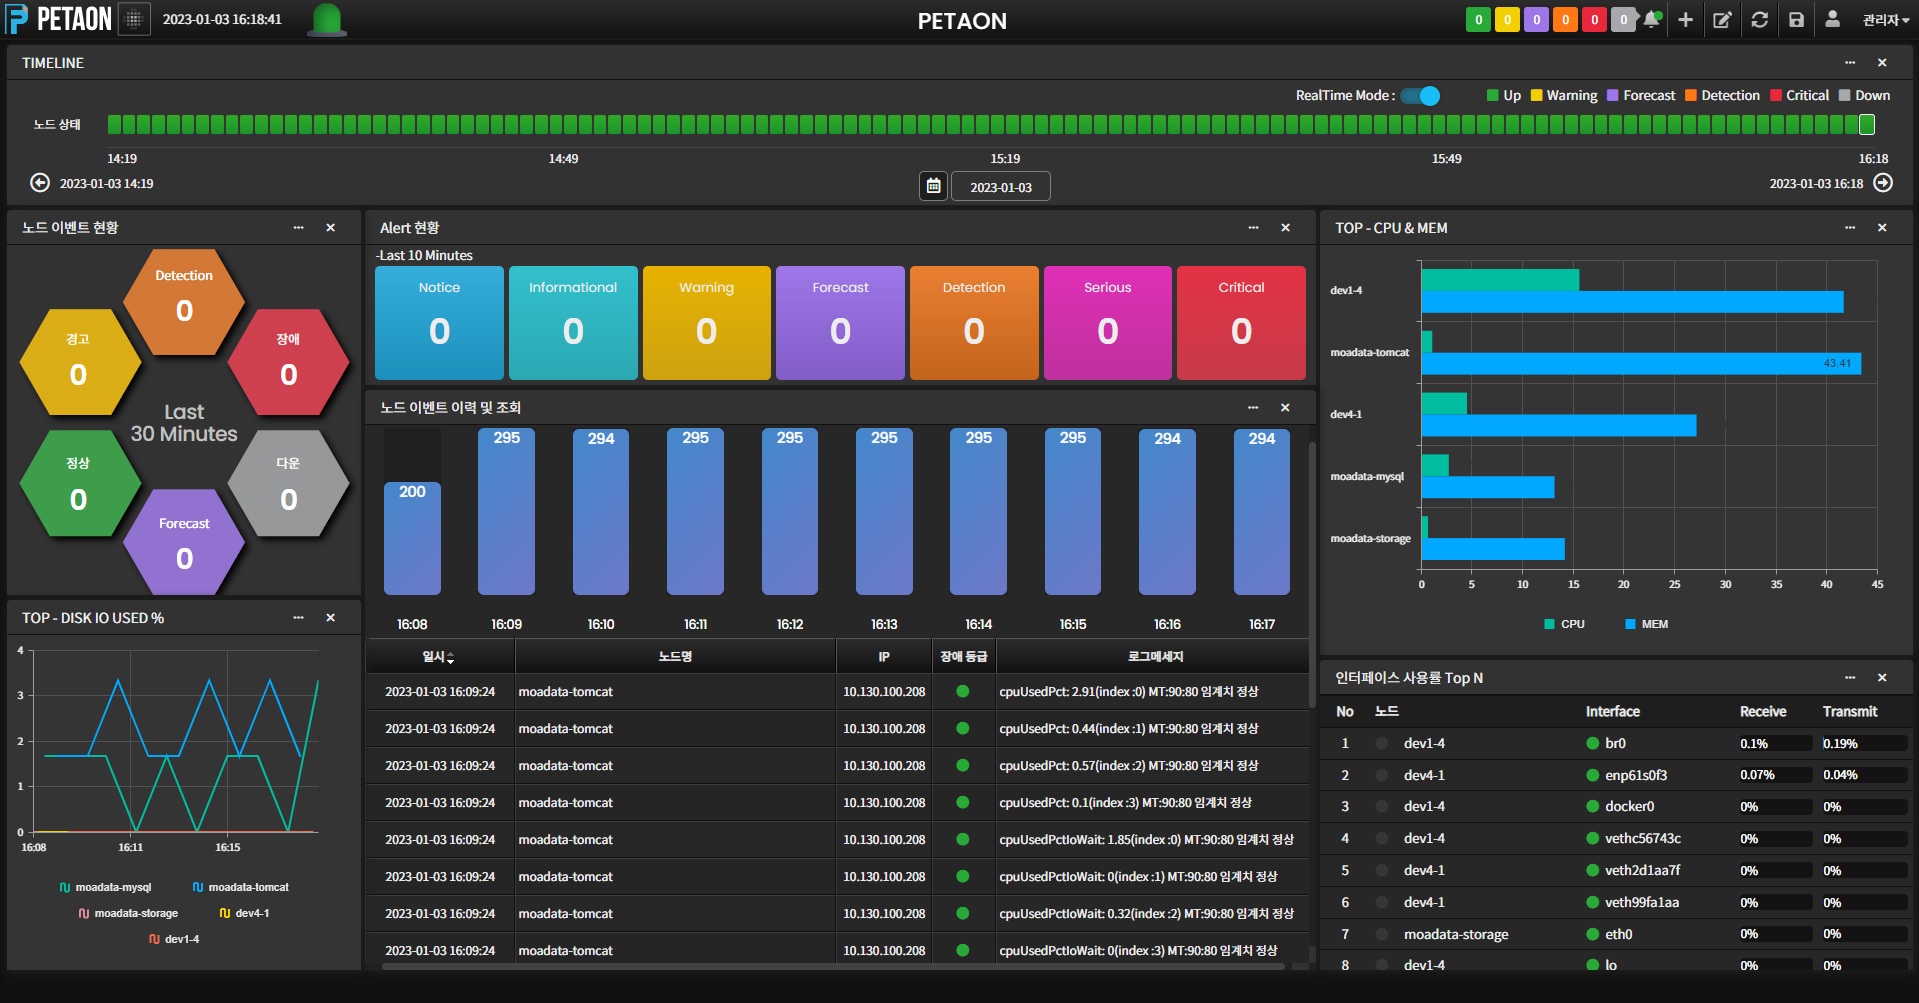
실시간으로 발생하는 모니터링, AI 이벤트의 종합 이력을 한 화면에 제공하고 보고서를 스케줄화하여 자동 리포팅 기능을 제공합니다.

이벤트 종합 이력 관리
- 알람은 크게 모니터링 알람과 인공지능 알람으로 구분되어 있습니다.
- 모니터링 알람은 Up, Unkown, Warning, Down/Critical 4가지로 구성 되며, 인공지능 알람은 인공지능의 이상 탐지와 이상 예측에 의해 생성된 알람입니다.
- 알람은 UI/UX 외 문자(SMS), 이메일 등 다양한 매체를 통해서도 전달할 수 있도록 지원합니다.
- 실시간으로 발생하는 모니터링, AI 이벤트의 종합 이력을 출력합니다.
- 검색 기능을 통해 특정 노드 또는 특정 이벤트 메시지를 조회하도록 제공 합니다.
- PDF,xls,hwp,html 등 다양한 확장자로 생성이 가능 합니다.
- 일별/주별/월별/연별 리포트를 스케줄화 하여 자동으로 생성하도록 제공 합니다.
- 생성된 리포트는 각 템플릿의 우측에 개별로 관리되며 편집과 삭제가 가능 합니다.
서비스 그룹별 발생한 이벤트를 직관적으로 인지하고 대시보드와 위젯의 커스터마이징 기능을 제공합니다.

서비스 중심 모니터링
- 서비스 중심 통합 모니터링은 단일 노드가 아닌 서비스를 구성하는 전체 노드에 대한 논리적 연결 정보 기준으로 서비스 토폴로지를 시각화하며, 서비스 상태, 구성 노드 간의 응답속도 등 전체적인 맥락 안에서 접근할 수 있도록 제공하는 모니터링 기능입니다.
♦ 그룹운영 현황 위젯
- 관리 대상 시스템 또는 서비스를 운영자가 정의한 그룹 중심으로 발생/예측된 이벤트를 나타내는 위젯으로 이벤트 발생 시 다른 색상으로 시각화되어 사용자가 식별할 수 있음.
♦ 차트 위젯
- 제공되는 다양한 형태의 차트(라인, 바, 파이, 표 등) 위젯들을 활용하여 사용자가 데이터 중 중요한 지표들을 지정, 모니터링하는 위젯들로 직접 구성 및 편집할 수 있도록 지원.
♦ 타임라인 위젯
- 지원 이벤트를 중심으로 과거 이벤트 시점으로 전환되어 이벤트 발생 시점의 데이터를 확인할 수 있도록 지원.
다양한 형태의 위젯과 커스트마이징 및 직관적인 통합 대시보드로 제공합니다.

메인 대시보드
- 대시보드에 배치된 위젯의 추가, 삭제, 이동, 크기 조절 기능을 제공
- 기본 배치 구성을 제공, 대시보드를 편집하여 사용자 계정 그룹별로 관리를 지원.

인공지능 대시보드
인공지능 대시보드는 인공지능 기능들을 통해 확인된 이상 탐지 및 이상 예측 결과를 사용자가 한 눈에 메인 살펴볼 수 있도록 합니다 .
